TDR and VOD Measurements#
Detonation velocity (VOD) is a critical parameter in understanding explosive reactions. Traditional methods, such as using resistance wires, are effective but can be challenging to implement consistently in production environments like mines. This article explores how Time-domain reflectometry (TDR) can simplify the measurement of VOD, even for very short charges (e.g., 160 mm in length), and examines a novel approach using helical cable wrapping to address measurement challenges.
Introduction to VOD Measurement
Detonation velocity, or the speed at which a detonation front propagates through an explosive, is a key explosive performance metric. Traditionally, resistance wires have been used. These wires are consumed by the detonation reaction, and the rate of change of resistances can be used to estimate the VOD. While reliable, this method has limitations:
It requires skilled operators to achieve consistent results.
It can be difficult to use in production environments, such as mines.
To address these challenges, Time-domain reflectometry (TDR) offers an alternative approach.
How TDR Works
TDR measures the electrical reflections along a transmission line (e.g., a coaxial cable) to detect changes in impedance caused by external factors. In the context of explosives testing, the TDR rate of change of the cable length as the detonation reaction consumes it.
Advantages of using TDR include:
Simplicity: It requires minimal setup beyond the TDR unit and a coaxial cable.
Ease of Use: It is more suitable for production environments than resistance wires.
Versatility: TDR can be adapted to various charge sizes and configurations.
However, measuring VOD for very short charges (e.g., 160 mm) presents unique challenges, primarily due to sampling rate limitations.
Challenges with Short Charges
For short charges, the high detonation velocities (often thousands of meters per second) mean that the detonation reaction travels quickly. TDR units, constrained by their sampling rates, may only capture a few data points. This limits the resolution and accuracy of the VOD measurement.
Proposed Solution: Helical Cable Wrapping
To overcome the limitations of short charges, one proposed solution involves wrapping the coaxial cable in a helical pattern around the charge cylinder. This approach increases the effective length of the cable exposed to the detonation reaction, allowing the TDR unit to capture more data points. At least that is the idea.
Why an Article?#
This is an intriguing problem. How do we map the rate of change of the cable in a helical pattern to the VOD that is measured axially along the charge cylinder length? Will a helical pattern increase the number of sample points?
Production Setup#
As the detonation reaction consume the TDR cable, the length it measures changes at a proportional rate (see figure 1). The TDR, in its most simple approximation, records the timestamp and the length of the cable. The rate of change of cable length is used to estimates the VOD.
Comparison of change in length. At each time step. The cable is consumed by the detonation reaction, and the TDR unit measures a different length.#
For typical blasting scenarios (see figure 2) where the charges are long (3 m or more), the TDR is perfectly sufficient gathering many measurements (depending on the VOD and charge length) to produce a sufficiently accurate trace. The cable is placed parallel to the axis of the charge column, providing a good opportunity to record a good VOD.
Basic long hole measurement.#
Boosters and Short Charges#
Unfortunately, when measuring smaller charges, say boosters which are very short compared to standard charges in mining, we may not capture enough points. We’ll consider a booster of dimensions of 50 mm x 160 mm (see figure 3). We can see the direction of detonation in figure 3.
How many points can we capture with a TDR?
Let’s assume:
The TDR has a sample rate of
256 kHz.booster length:
160 mm.VOD:
4000 m/s.Ideal conditions, no loses, no lag and no run up.
That the booster is initiated at the bottom.
Detonation reaction reaches full velocity instantaneously (no run-up).
Detonation velocity is constant (implying reaction is constant).
If the TDR is sampling at 256 kHz, that means a measurement is taken approximately every 3.91 µs.
If the VOD is 4000 m/s, that translates to 4 mm/µs.
At 4 mm/µs, it would take 40 µs to travel the 160 mm.
That means the TDR unit could capture 40 µs/3.91 µs about 10 readings.
Note
The number of points that the TDR can capture is highly dependent on the VOD of the detonation reaction and the sample rate. Slow sample rate or very fast VOD mean less points captured.
50 mm x 160 mm booster with direction of VOD.#
Can we Capture More Points?#
If we could capture more points along the charge length, we would get a better curve and obtain a more accurate estimate of VOD.
How could we do that? Easy, use more cable!
If we wrapped the cable around the booster in a spiral pattern, more cable would be exposed to the detonation reaction. We can see the premise in figure 4 and the shape is called a helix (see figure 5).
50 mm x 160 mm booster wrapped with spiral pattern.#
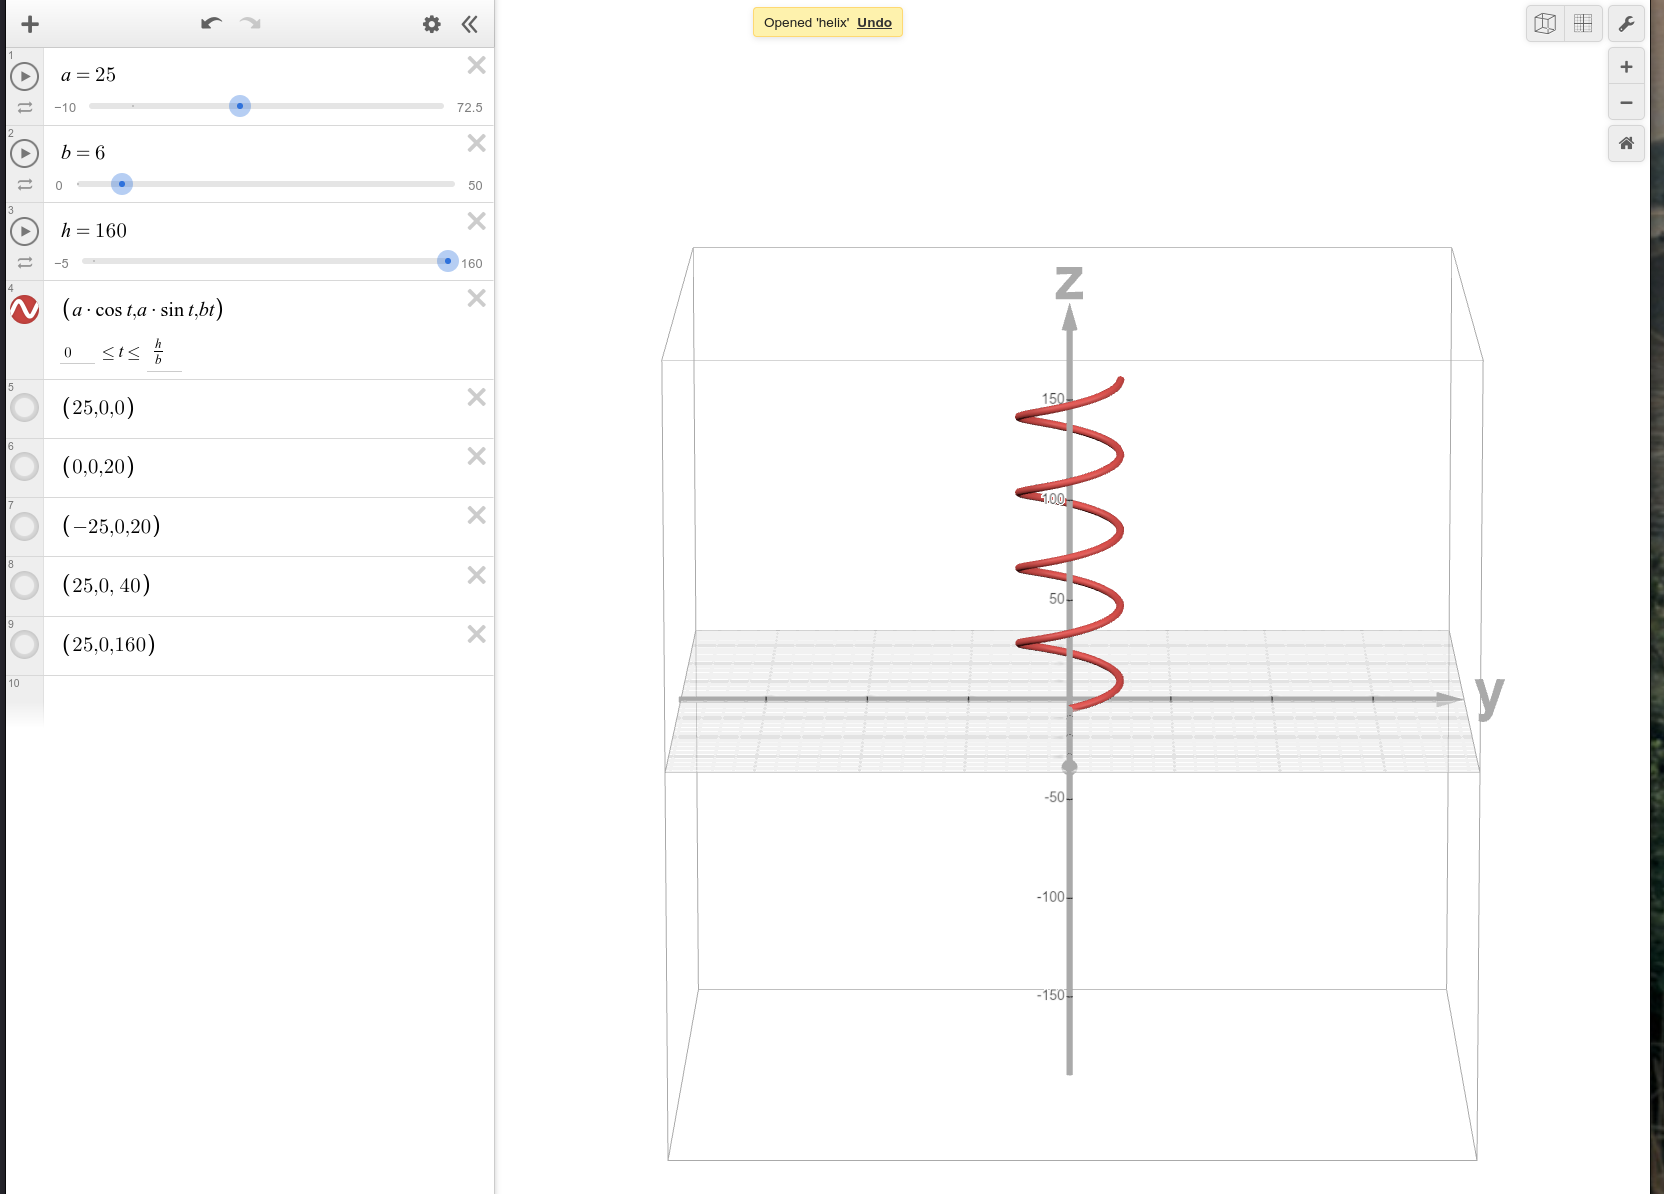
3D Helix.#
Why a Helix?#
The helix is an easy to curve to construct, particularly if you have a physical cylinder to work with. It can be made consistently by simply marking loop spacings on the shell. The key is that it can be constructed consistently. It would be very difficult if the loop spacing were different from loop to loop (not impossible, but would require custom calculations for each shot and a diligent record of the loop construction).
Problem with a Helix#
If you examine figure 4 closely, you’ll notice that the direction that the detonation reaction travels is perpendicular to what is being measured by the TDR.
How do we reconcile this?
We can’t simply take the rate of change of the cable length and compute the VOD. We have to map the change in cable length back to a change in length of the booster. This isn’t difficult, but it isn’t trivial either!
The first step is understanding the length of the cable in the helix, from the bottom of the charge to the top of the charge. Once we understand how to compute the length of the consumed along the helix, we can determine where it sits on the cylinder and translate that to a height on the cylinder.
How Long is the Curve? A Geometric Approach#
Looking at figure 4, we know the length of the booster (160 mm), the diameter (50 mm) and the spacing between loops (20 mm).
Note
What is the spacing between loops? We’ll, let’s define it as the distance between wrapping the loop one complete revolution ending up in the same spot, except, offset by the loop distance (in our case 20 mm higher than our start point).
If we imagine the shell casing to be a piece of paper, we could cut and unfold the outside shape, leaving us with a length of wire (one full turn around the cylinder) in figure 6.
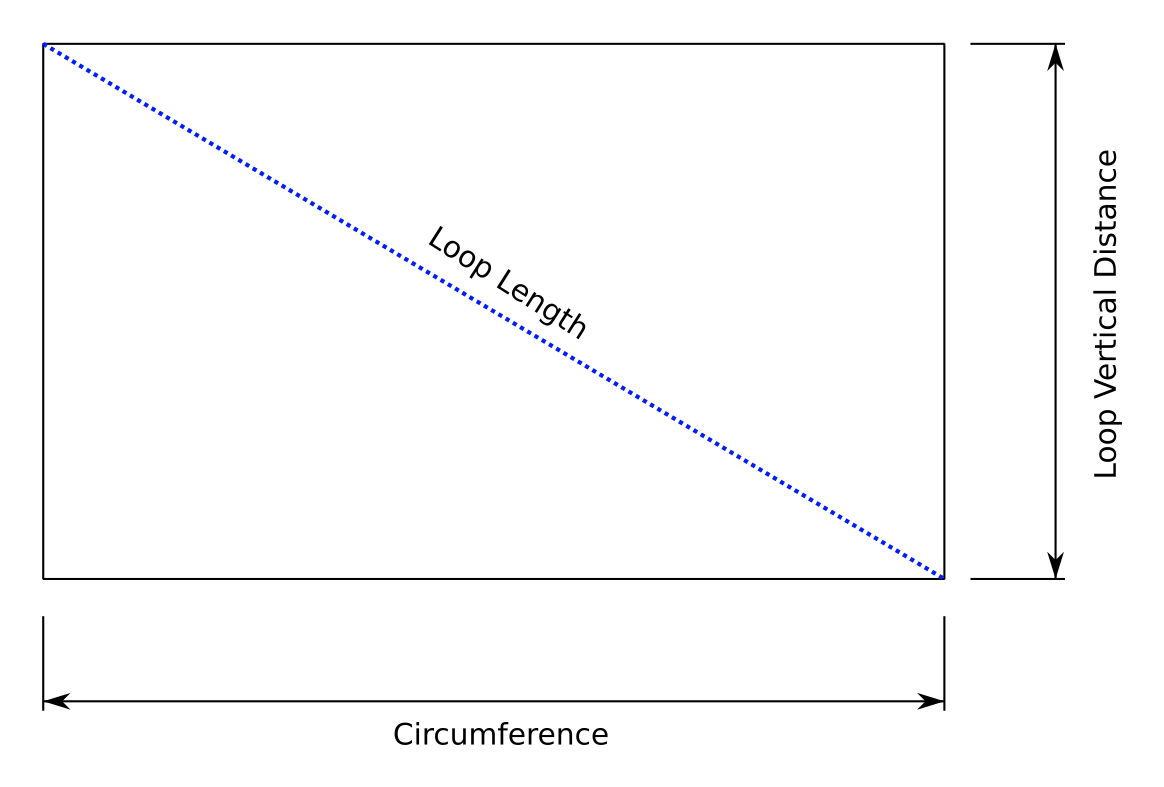
Spiral loop unwrapped.#
We know that the circumference is: \(\pi \cdot 50\). We also know the height is 20 mm.
That would make the loop length = \(\sqrt{(\pi \cdot 50)^2 + 20^2}\).
We multiply it by the loop count to find the total length.
In our case, we have 8 loops.
The length per loop is: 158.35 mm.
The total length of our cable is: 1266.78 mm.
This approach gives us an intuition as to how to solve the problem. We can use similar triangles and ratios to solve for points along the curve. But, this approach is cumbersome, but does provide good intuition.
How Long is the Curve? Let’s do some Calculus#
The parametric equation of a helix is:
Where:
\(x\) - The x-coordinate of the helix at \(t\)
\(y\) - The y-coordinate of the helix at \(t\)
\(z\) - The z-coordinate of the helix at \(t\)
\(t\) - The angle of the curve
\(r\) - Radius of the cylinder.
\(b\) - A constant.
Note
We assume the axis of the cylinder aligns with the vector (0,0,1), that is, the normal of the XY plane. We assume the cylinder base coordinate is at the origin, (0,0.0).
Let’s define variables for our booster:
h - Height of the cylinder (160 mm)
d - Diameter of the cylinder (50 mm)
l - The distance between successive loops of the helix (20 mm).
What is \(b\)?
The constant \(b\) is associated with our z-coordinate.
We can use it to make sure that the helix passes through our loop spacing criteria \(l\).
That is, we can use it to ensure that our loops are l = 20 mm apart.
How do we do that?
Solve for b:
We mentioned earlier that the loop distance should be one complete revolution. That means \(z(t) = l\) when \(t = 2 \pi\). Therefore:
How do we limit the helix to the length of the cylinder?
We want to restrict the cabling in the helix to the length of the charge cylinder. We also know:
Solving for \(t\):
Therefore, our limiting range will be:
The complete description of the helix:
Where:
We have the helix in terms of a system of parametric equations related to our booster (the system is defined generically). How do we get the length? Simple, we use a line integral (good notes).
The line integral of a scalar field, \(f(x, y, z)\), along a curve \(C\) described by the vector function:
where \( t \in [0, \frac{h}{b}] \), is given by:
For the vector function \( \vec{r}(t) = (x(t), y(t), z(t)) \), its derivative is:
The magnitude of \( \vec{r}'(t) \) is:
Since we are only interested in the arc length, we set \(f(\vec{r}(t)) = 1\) which simplifies the integral:
What are the derivatives?
The integral becomes:
Simplifying the integral:
Integrating the definite integral:
This leads to the following formula for the arc length of the curve from 0 to \(\frac{h}{b}\):
Based on the calculus, how long is the helix?
Let:
h = 160 mm
l = 20 mm
r = 25 mm
The length agrees with the value computed in the previous section.
Map the Helix to the Cylindrical Axis#
Recall, the TDR essentially measures the length of the cable (see figure 1). A TDR for detonation velocity measurement does this really, really quickly! The TDR has no idea how the cable is oriented in space. Whether it is straight, a helix or a knot. All we know is the length of the cable at any particular point in time during the detonation process.
When the cable is wrapped around the cylinder forming a helix, the distance along the helix will not equate to the axial detonation velocity of the cylinder. What we want is the value of the function \(z(t)\). We need to translate the distance measured by the TDR, \(\Delta C\), to the arc length on the curve and obtain \(t\). Once we have \(t\), we can determine the axial distance along the cylinder.
Let:
Where:
\(\Delta C\) - The difference line cable length from \(t_{n-1}\) to \(t_n\).
\(x\) - This is the angle along the curve corresponding to the arc length.
Note
We are interested at some point along the helix, we’ll call that \(x\). Recall \(\frac{h}{b}\) is the end of the helix that coincides with the length of the booster.
Solve for \(x\):
Solve for \(z(x)\):
At this point, we have the equation to map a distance from the helix to an axial distance along the booster! We can map the measurements from the TDR to the axial distance along the charge cylinder.
Does this make Sense? Let’s Simulate#
Now that we have a relationship, how does it work? Let’s simulate a constant detonation propagation and simulate what we could measure from a theoretical TDR.
We have the following parameters in Table 1: Simulation Parameters below:
Parameter |
Value |
Unit |
Description |
|---|---|---|---|
VOD |
4000.0 |
m/s |
|
4.0 |
mm/μs |
||
SR |
256.0 |
kHz |
|
3.906 |
μs |
Time step |
|
VOD*SR |
15.625 |
mm |
Distance the detonation wave moves per time step |
r |
25.0 |
mm |
|
d |
50.0 |
mm |
|
l |
20.0 |
mm |
|
b |
3.183 |
mm |
|
sqrt(r^2 + b^2) |
25.202 |
We know, the sampling rate and the detonation velocity.
Therefore, we can calculate the change in charge length.
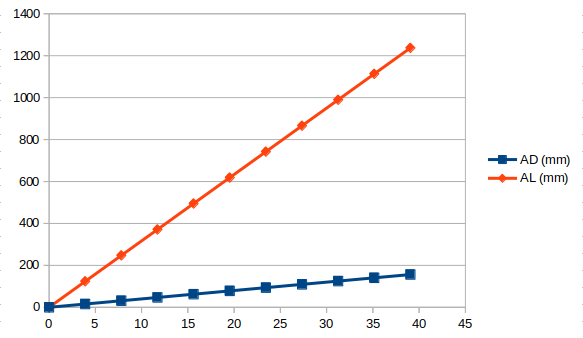
The calculation is laid out in Table 2: Simulation Results, column AD.
Column AD represents the distance the detonation reaction travels along the axis of the charge cylinder at time t.
Column AL represents the mapping from the axial distance to the arc length distance (equation (24)).
Column C represents the length of the TDR cable as it is consumed during the detonation reaction.
t (μs) |
AD (mm) |
AL (mm) |
C (mm) |
|
|---|---|---|---|---|
0 |
0.00 |
0 |
0.000 |
10,000.000 |
1 |
3.91 |
15.625 |
123.709 |
9,876.291 |
2 |
7.81 |
31.250 |
247.418 |
9,752.582 |
3 |
11.72 |
46.875 |
371.128 |
9,628.872 |
4 |
15.63 |
62.500 |
494.837 |
9,505.163 |
5 |
19.53 |
78.125 |
618.546 |
9,381.454 |
6 |
23.44 |
93.750 |
742.255 |
9,257.745 |
7 |
27.34 |
109.375 |
865.964 |
9,134.036 |
8 |
31.25 |
125.000 |
989.673 |
9,010.327 |
9 |
35.16 |
140.625 |
1,113.383 |
8,886.617 |
10 |
39.06 |
156.250 |
1,237.092 |
8,762.908 |
160 |
1,266.782 |
8,733.218 |
The last row in Table 2: Simulation Results, is a check and shows that at 160 mm (the booster length), the arc length of the helix matches our calculated length.
Note
Table 1: Simulation Parameters, uses the VOD to estimate the position along the booster axis so we can get realistic numbers for arc length consumption.
If we plot the velocities (figure figure 7) we can see what would be measured by the TRR is significantly steeper. In fact, the velocity as measured axially along the booster is 4000 m/s (as we expect) while the slope of the curve measured by the TDR would be 31,669 m/s. Quite a difference, which can be explained by the fact that spiralling the cable around the cylinder consumes more cable per unit time than a linear measurement.
Note
In reality, we would collect data from the TDR, which would be columns t and C. We would back calculate AD.
Measured Spiral VOD (31,669 m/s) vs. Actual VOD (4,000 m/s).#
Finally, How Many Points can we Measure on the Helix?#
It doesn’t look like increasing the length of the cable by wrapping it around the booster increases the number of sample points. Based on the simulation in the last section, we still only get 10 points. That makes sense because the detonation reaction is moving axially along the booster.
Conclusion#
I went into this under the assumption that we’d get more points measured for VOD based on spiralling the cable around the booster. I have been told that the resolution increases. This does provide a significantly longer length of cable that is in contact with the booster. However, it doesn’t provide more measurement points.
Sure, larger sections of the cable are consumed because of the helical pattern. From a mathematical perspective, the number of ‘points’ measured along the cable stays the same. Where this might help increase accuracy, is that the helical pattern provides a large length delta between successive cable measurements. This is something a purely mathematical treatment cannot discover. It would take field work and experimentation to confirm.
Based on the math and the simulation, the number of points measured does not increase.
Spiralling the cable around the charge cylinder raises other questions. Are we measuring detonation in this configuration? Based on the configuration of the measurements, we may be measuring Gurney Energy indirectly. Generally, an expanding cylinder test measures the expansion of a copper cylinder filled with explosives. The helical spiral may be measuring Gurney parameters for the booster casing and not VOD.
Another issue, when exactly does the cable break? Is it consumed by the reaction or stretched apart by radial gas expansion?